
Statistics Sound Authoritative
But then again, so do I

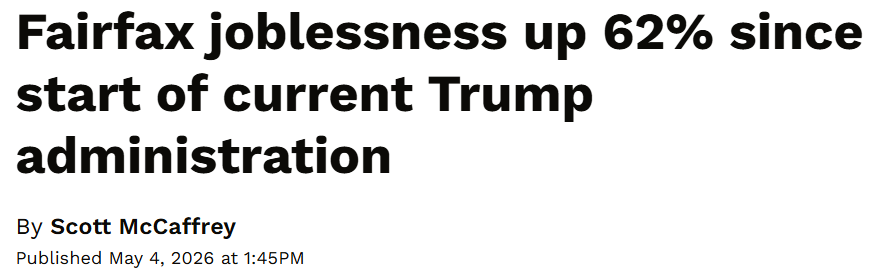
This recent headline in the online news source FFXNOW (Fairfax Now) looked alarming when I first saw it. Any negative datapoint that has risen 62% sounds a little apocalyptic. And it is bad, that’s for sure. But I want to unpack it a little.
This is what the first few paragraphs say:
The number of Fairfax County residents counted as unemployed has risen 22% year-over-year and 62.5% since the beginning of the second Trump administration, according to new data.
A total of 23,518 residents were recorded as seeking jobs in February, according to data reported last week by the Virginia Department of Workforce Development and Advancement.
That’s up from 19,315 in February 2025, and up from 14,465 in December 2024, the last full month of the Biden administration.
This table shows the unemployment figures:
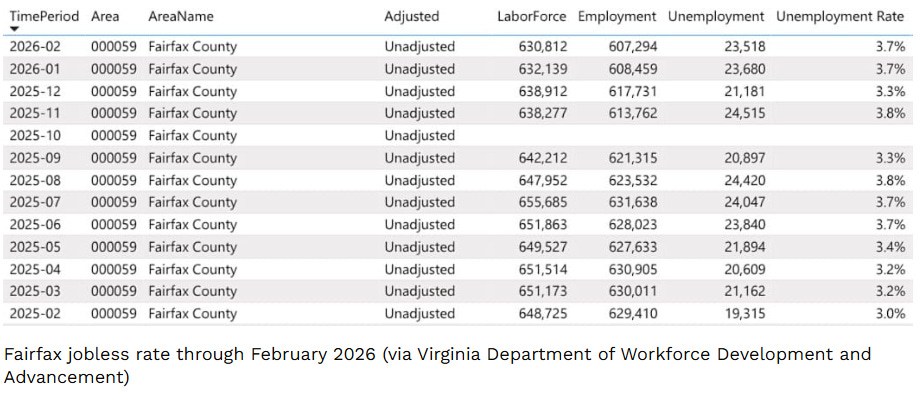
I want to look at a couple of columns on this chart.
First, the Laborforce column notes the number of people either employed or actively seeking employment. When this number declines (as it has from its peak in July 2025), this means one of three things has happened: the individuals may have stopped looking for work, stopped receiving employment benefits (perhaps because their eligibility expired), or moved away from the area in search of employment.
Second, the number of employed people has also declined over the same period.
Third, the number of people with jobs has also gone down.
During this same time period, the population of Fairfax County rose by about 0.7%.
The article notes that the February job data was reported only two weeks after January’s report – due in part to reporting lags stemming from last fall’s seven-week federal government shutdown. The article goes on to say that the entire Metro DC area is experiencing a similar decline in employment, due in part to the shrinking federal workforce caused by Trump’s DOGE task force in early 2025.
Here’s the article if you want to check it out.
But I ran into a problem when I checked the data reported in this article. Although the year-over-year increase (from February to February) comes to about 22%, as the article notes, the scarier number – 62% “since the beginning of Trump’s second term” does not compute. 3.7% does not represent a 62% increase from the earliest number on the chart – February, 2025. What gives? So I looked up the rate from January, 2025, which was 2.7%. But even that number doesn’t provide a 62% increase. It represents a 37% increase – still a big number, but not as big or as threatening as the 62% figure. I could only get the larger number by going back to the December 2024 unemployment rate of 2.3% – again, not on the chart – which gives us a percentage increase of 61%.
So the number is real-ish, but the article doesn’t prove that. At least I don’t think it does. If there are any oh-I-don’t-know statistics teachers out there (I mean, what are the odds?), please double-check my math.
Anyway.
If this feels like old news, that’s because the firehose of news generated by the Trump administration makes us memory-hole problems that should still be getting public attention. His attack on the federal government has real consequences – including just this week, when devastating tornadoes in the Midwest were more dangerous than usual because the National Weather Service no longer has the resources to provide storm warnings early enough for people to be prepared.

You can read this article here.
As one of the members of my family (who is a federal employee) said when Trump first began to attack the federal workforce, “You’ll miss us when we’re gone.”
Well, I can't decide if the numbers - or perhaps just the headline - in your article are what we used to call "damn statistics" or "lies". While I remember precious little from my stat course way back in the 1600's, I do remember being warned over and over again, that percentages are too easy to distort and I think you have identified a whopper.
There's a current TV commercial for something that is [about] "500% less" ... what does that even mean. I think this article was either written by someone who doesn't understand the math, or is purposefully misleading. I looked at the column for unemployment rate and saw that it remained pretty constant. I think that tells the actual story. Very interesting. Thanks.