Geographic Differences in College Acceptance in Virginia

The Virginia Public Access Project (VPAP) is a daily online news source about all things Virginia. In today’s edition, they published a graphic showing the varying rates of college acceptance across Virginia. I thought it was interesting and I wanted to show it to you.
Here’s the link if you want to check it out for yourself.
https://www.vpap.org/visuals/visual/va-college-acceptance-rates/
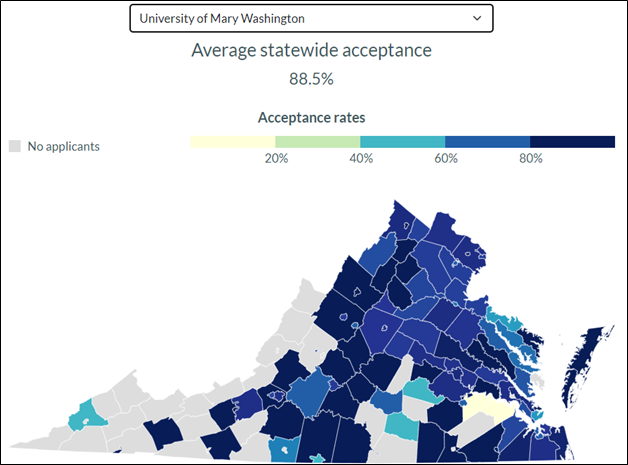
The graphic shows Virginia College Acceptance Rates by county across Virginia. It provides the statewide acceptance for all 4-year public schools in Virginia, and then breaks the data out by school.
Before we look at the graphic, let me give you a bit of information about the colleges VPAP examines:
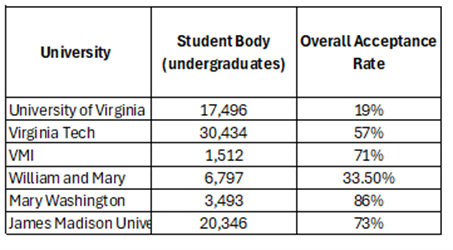
Now let’s identify what’s what in Virginia.
This map shows the admission rates to the University of Virginia – at 31.2%, which was the lowest of all of the universities considered in this analysis.
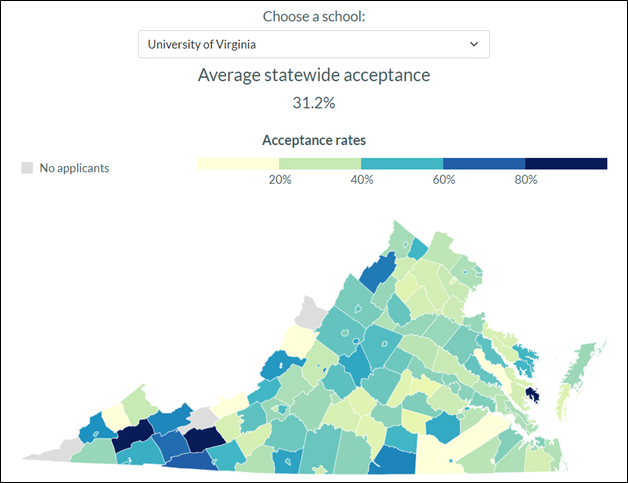
What can we determine from this map? First, it’s important to know that the light green area toward the top of the map includes Loudoun County and Fairfax County, Virginia – two of the wealthiest counties in the country and the wealthiest counties in Virginia. Why would their admission rates to the premier school in the state (at least in terms of the difficulty of admission) be low? Their schools are the best in the state. What’s going on here?
The high admission rates in the westernmost and rural parts of the state provide a clue, I think. As a state university, UVA is under some pressure to admit students from across the state. The law of small numbers plays a role, I think. When I clicked on the map on the website, I saw that in Russell County (the black state furthest west) 100% of the students who applied were admitted – one student applied and he/she was admitted. In Fairfax County, 4,302 students applied to UVA, and 1,272 were admitted – 29.6%. You can click around this map on the website and see if you figure out what these admission rates mean – if anything.
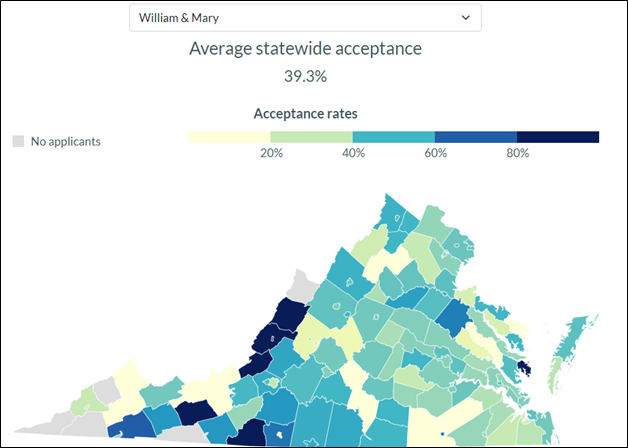
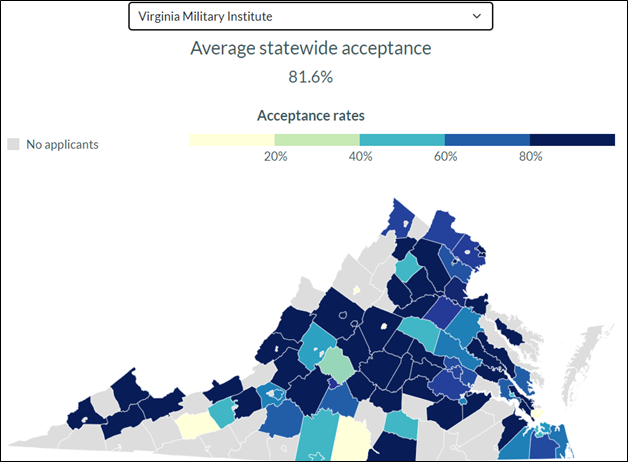
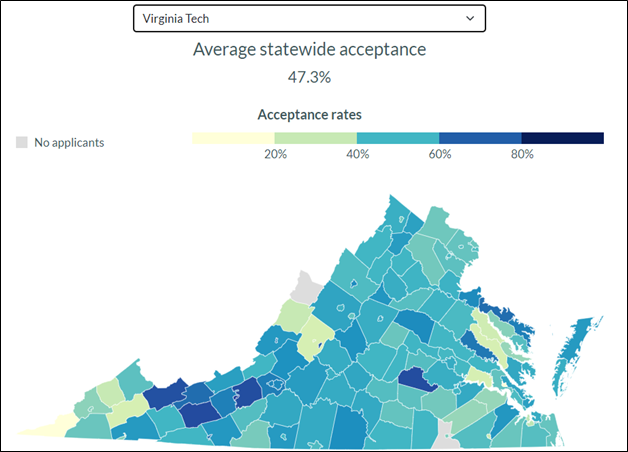
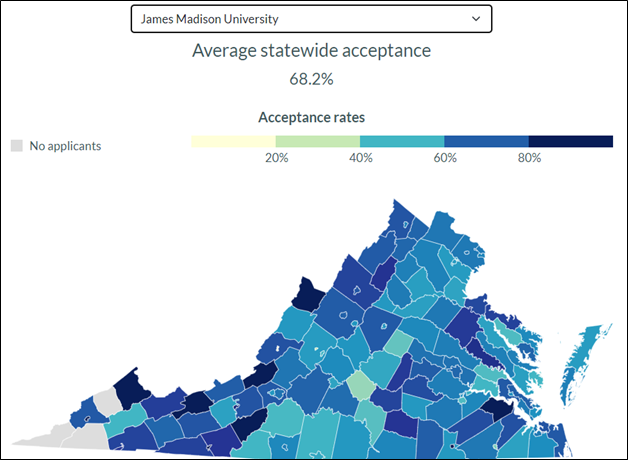
Here are the maps for the other five schools. What differences and similarities do you see? If you were a parent of high school kids trying to figure out a strategy for applying to public universities in Virginia, what conclusions would you draw? If you were a state legislator in Virginia, what would you do about some of these disparities – if anything?