
Calculating the Deficit


About 10 days ago on Facebook, one of my friends posted the article referenced in the picture above. The headline stimulated one of his FB followers to comment “Not quite sure how that math works with all the Dem's spending? The math doesn't work out!” I responded with the following comment:
“The explanation lies in the difference between budget authorization (promised funding of government programs), appropriations (single year permission to spend the money) and outlays (money actually spent). The big "dem spending" you reference is multi-year (sometimes up to 10-years) authorization. When you get the apples and oranges sorted into the right baskets, the math works out.”
Shockingly, this exchange did not lead to a full and civil discussion of the relationship between long-term government spending and short-term inflationary pressures. (I know, right?) So I’ve been ruminating on this issue for a while and decided to write about it in more detail today.
The following chart provides a breakdown over time of the impact of two bills passed by Congress – the Inflation Reduction Act and the Chips and Science Act. (You can find similar charts about other pieces of legislation — this one was just handy.)
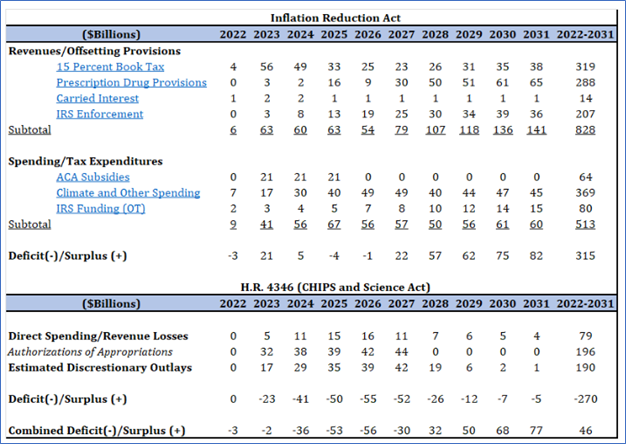
Keep this chart handy as you read the following paragraphs.
The definitions and discussion that you’ll find below are from the website of the Congressional Budget Office, which was established in 1975 to provide independent analyses of budgetary and economic issues to support the Congressional budget process.
Each year, the agency’s economists and budget analysts produce dozens of reports and hundreds of cost estimates for proposed legislation. CBO is strictly nonpartisan; conducts objective, impartial analysis; and hires its employees solely on the basis of professional competence without regard to political affiliation. CBO does not make policy recommendations, and each report and cost estimate summarizes the methodology underlying the analysis.
You may remember hearing about the CBO when major pieces of legislation are under consideration and people are waiting for the “CBO Score” which lets us know the impact of legislation on the deficit, as required by budget resolutions. Here’s the CBO website if you want to know more about the work of this organization. https://www.cbo.gov/about/overview
There are four terms you have to understand if you want to understand how the government spends its money: Authorization, Appropriations, Obligations, and Outlays. I’m going to talk about them briefly.
Authorization: This is the amount of money available to a federal agency for a specific purpose. The authority to commit to spending federal funds is provided to agencies by law. Authorizations are often multi-year – like the bills in the preceding chart. Authorization Acts establish or continue the authority for agencies to conduct programs or activities. Such laws delineate a program’s terms and conditions—often, its duration and eligibility rules. Authorization legislation is produced by authorizing committees in the House and Senate. Authorizing committees are set up to examine budget proposals for specific areas of government spending – armed services, agriculture, the judiciary, for example. There are 15 authorizing committees in the House and 14 in the Senate. The budget requests from every government agency are first dealt with in the relevant authorizing committees in the House and Senate
Appropriation Acts: These bills specify the amount of authorized funds that may actually be spent in a given fiscal year. There is an Appropriations Committee in each house; every piece of authorizing legislation that comes out of the Authorizing committees has to go through a second process in the Appropriations Committee in each house to have the power to spend the money that has been authorized. The Appropriations Committees have subcommittees that parallel the authorizing committees. For example, the Defense Subcommittee of the Senate Appropriations Committee considers appropriations authorized by the Senate Armed Services Committee. Got it? There are not supposed to be any “new” programs in the Appropriations Bills that have not been previously authorized, although sometimes Congress breaks its own rules. Imagine that!
Given the extended time over which budget decisions are made (as long as two years from budget proposal to program implementation), things often change. In these situations, the agencies can ask for a supplemental appropriation. This is what DOJ has done as its workload has ramped up due to the prosecution of participants in the January 6 insurrection and various court cases related to The Former Guy (I don’t like to mention his name). When the 2022 DOJ budget was first proposed in the beginning of 2020, no one knew that the agency was going to need to beef up its litigation staff in order to pursue all the criming associated with The Former Guy.
Obligation: This is a legally binding commitment to spend money in a certain way within a certain timeframe. An example of this might be a contract to buy equipment; the obligation may be incurred this month, although the fulfillment of this contract might take months or years. Obligations fall in the power of the government agencies. The Department of Justice, for example, can decide how and when (within the legislative parameters) it spends the money that has been appropriated to it.
Outlays: This occurs when a federal agency issues checks, disburses cash, or makes electronic transfers to liquidate (or settle) an obligation.
As you can see on the chart I showed you earlier, the only figures that go into the calculation of the deficit are the expenditure and outlay figures. So the commenter on my friend’s Facebook post has confused the total amount of spending in these pieces of legislation – which rise above the $1 trillion mark – with the legislation’s impact on the 2022 budget deficit, even though much of the spending (and savings) for these bills is anticipated for the out-years – budget-speak for “the future.”
Here's an analogy for all of this that might help, although it’s not a complete analogy.
Authorization: Think of this as the maximum credit limit on your credit cards or a line of credit secured by the equity in your home. This money is available for you to spend, but you haven’t spent it yet. Now, for most of us, we don’t have a plan to actually charge up to our credit limit or draw down that line of credit, but it’s there if we need it.
Authorizations for government spending differ in that the expectation is that government agencies will actually spend this money.
Appropriation: Think of this as a family budget. What do you plan to spend overall this year? What do you plan to spend for your upcoming vacation? What are your plans for Christmas? This is a short-term decision to spend money. But again, you haven’t spent it yet.
And again, the meaning of this in government is slightly different. If you don’t spend all of your budgeted money on your vacation, you’re pleased. You can spend that money on something else fun or to pay your upcoming electric bill. The government is required to spend the appropriated amount. Not spending the authorized amount is called impoundment, and it was made illegal in the 1970s because President Nixon had decided that one way to kill programs he didn’t like was simply to tell the executive department agencies not to obligate or spend the appropriated funds.
You may know of people who worked for a federal government agency (or maybe you did), and you know about the issue of needing to spend appropriated funds by the end of the government fiscal year (September 30 of each year). If this money is not spent, the Treasury Department scrapes it back and the agency no longer has access to it. That’s why government agencies sometimes redecorate their offices in September.
Obligation: This might be your commitment to buy a car and pay over time, get a mortgage on your house, or charge something to your credit card. You may not have actually spent all of the money, but you are on the hook for it.
This is directly analogous to government spending.
Outlays: This is the money you actually spend. This is the check you write or the online expenditure you approve.
Again, this is directly analogous to the government.
The deficit calculation is a simple one. Compare the amount of money you have to the amount you have spent (your outlays). If you spent more than you have, you run a deficit. If you have more than you spent, that is a surplus. Pretty simple, right?
It can be more complicated than this, as you probably would anticipate. For example, a year’s outlays probably include funds that were authorized earlier (maybe even years earlier), and that may have been obligated earlier as well.
When you look at the charts above, you’ll see that the approval of this legislation will add to the deficit in the short-run while but create a surplus in the long run. One problem is that voters usually vote in the short run, and aren’t willing to invest in the future. They want immediate results. One of the most famous economists of the 20th century, John Maynard Keynes, wrote once that “In the long run we are all dead,” warning that we can’t defer the benefits of policy changes for too long – that there is something good about consequences we can all envision and experience.
One thing to note — all of the Congressional Republicans screaming about “Democratic spending” know that they are misleading the public. They have seen these charts. They just assume that you haven’t.
Just one more analogy to make the point. I have friends who have installed solar panels on their roofs. They acknowledge that it will be costly in the short run, but that they will recoup those costs by the reduced costs of electricity after just a few years – current estimates are something like 6-10 years. They are willing to run a temporary deficit in exchange for long-run savings.
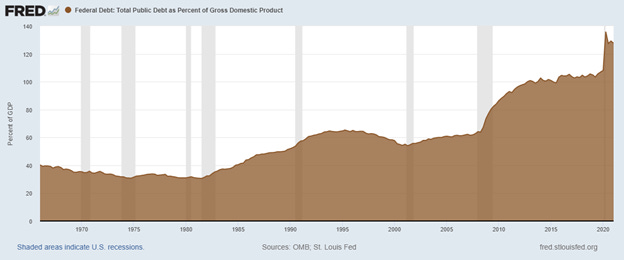
So if you’re still with me (and I salute you!), now you are probably asking, “So, now I understand the Budget Deficit. But what is the National Debt?” The National Debt is the accumulation of annual deficits over time. Here are a few graphs about the National Debt, but I don’t plan to write a lot about it today.
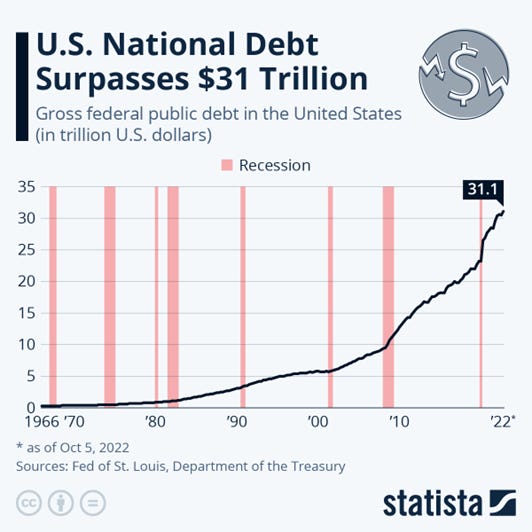
The important thing to understand about the National Debt is that, in order to pay it back, the government would need to run a surplus for probably decades. That is unlikely to happen.
And even though I just said I wasn’t going to write much about the National Debt, I want to address (briefly) the question that is always asked: Who do we owe the National Debt to? (awkward question but you know what I mean).
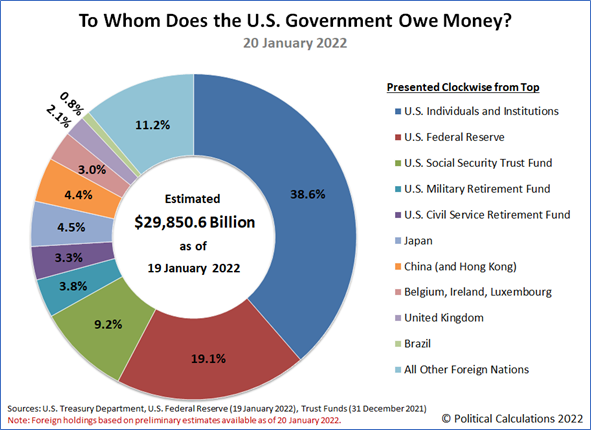
The important thing to understand about this chart (and I promise I won’t talk much more about the National Debt) is that governments, institutions, and individuals who hold US debt instruments (treasury bills and the like) do so because they believe that it is a safe investment. Political or economic uncertainty makes investors nervous. If China or Japan decided they didn’t want to support the American economy any longer, they would simply sell their US treasury notes – uninvesting in the American economy – and invest their money elsewhere. We need to be able to borrow at good interest rates so long as we run deficits. In case you’ve ever wondered, this is one reason why we kiss up to China.
Good one! 38.6% of the population is owed money by the Federal government. Does that percentage reflect the level of confidence that investors have within our country and does that percentage have a corresponding scale? That is, if more investors within the country have faith in our financial capabilities, will that percentage increase? Or would an increase/decrease simply reflect interest rates?